

From data to a dashboard with AI - Power Query and Excel
Do you work with data in Excel and feel that too much of your time goes on cleaning data, fixing formulas or putting reports together? On this hands-on training you will learn to use ChatGPT or Claude as an assistant, so you get from raw data to clear analysis and a finished dashboard faster.
This is not a course about memorising dozens of Excel functions. What you will learn instead is how to hand your task to AI so that it helps you find a workable solution, explains the errors, and walks you through it step by step.
Trainer

Course structure
Tap a module to see its contents
- Morning coffee, arrivals and informal conversation (09:45-10:00)
- How to use ChatGPT or Claude while working in Excel (10:00-10:45)
- What a good prompt for a data task is made of, and what information AI needs from you
- Which data you can share with AI, and where you need to be careful
- Bringing raw data into Excel, cleaning it, combining it and reshaping it into a usable form (11:00-12:15)
- Using AI to make sense of Power Query logic, and to write or explain M code
- Situations where Power Query throws an error, or the result is not what you expected
- Using AI to write and fix Excel formulas (12:45-13:15)
- Summarising data and answering questions from it
- How to check whether the formula or analysis AI suggested is correct
- Choosing the right metrics and charts, and putting a simple dashboard together (13:15-14:00)
- Using AI to plan a dashboard and choose the visualisations
- Everything from the day, brought together: from raw data to a cleaned dataset, an analysis and a dashboard
- Wrap-up and questions
Personalised and immediately applicable
The greatest strength of the training was personalisation. Every lesson built on our company's real situations and processes, not textbook examples. The balance of theory and practice and the concrete tips helped us quickly adopt new working methods. The training gave us tools that can be applied immediately, not knowledge that ends up in a drawer.


ENN LAMP
Fiskostar OÜ
CEO
Learning outcomes
What you'll be able to do:
use ChatGPT or Claude to work through Excel and data tasks;
give AI instructions clear enough - and the background it needs - to solve a data task;
import, clean, combine and reshape data with Power Query;
use AI to build Power Query solutions, to work out what an error means, and to help with Excel formulas and data analysis;
choose visualisations that suit your data and build a simple dashboard in Excel;
check whether the solution and the result AI suggested can actually be trusted.
The course takes place at our Tallinn office
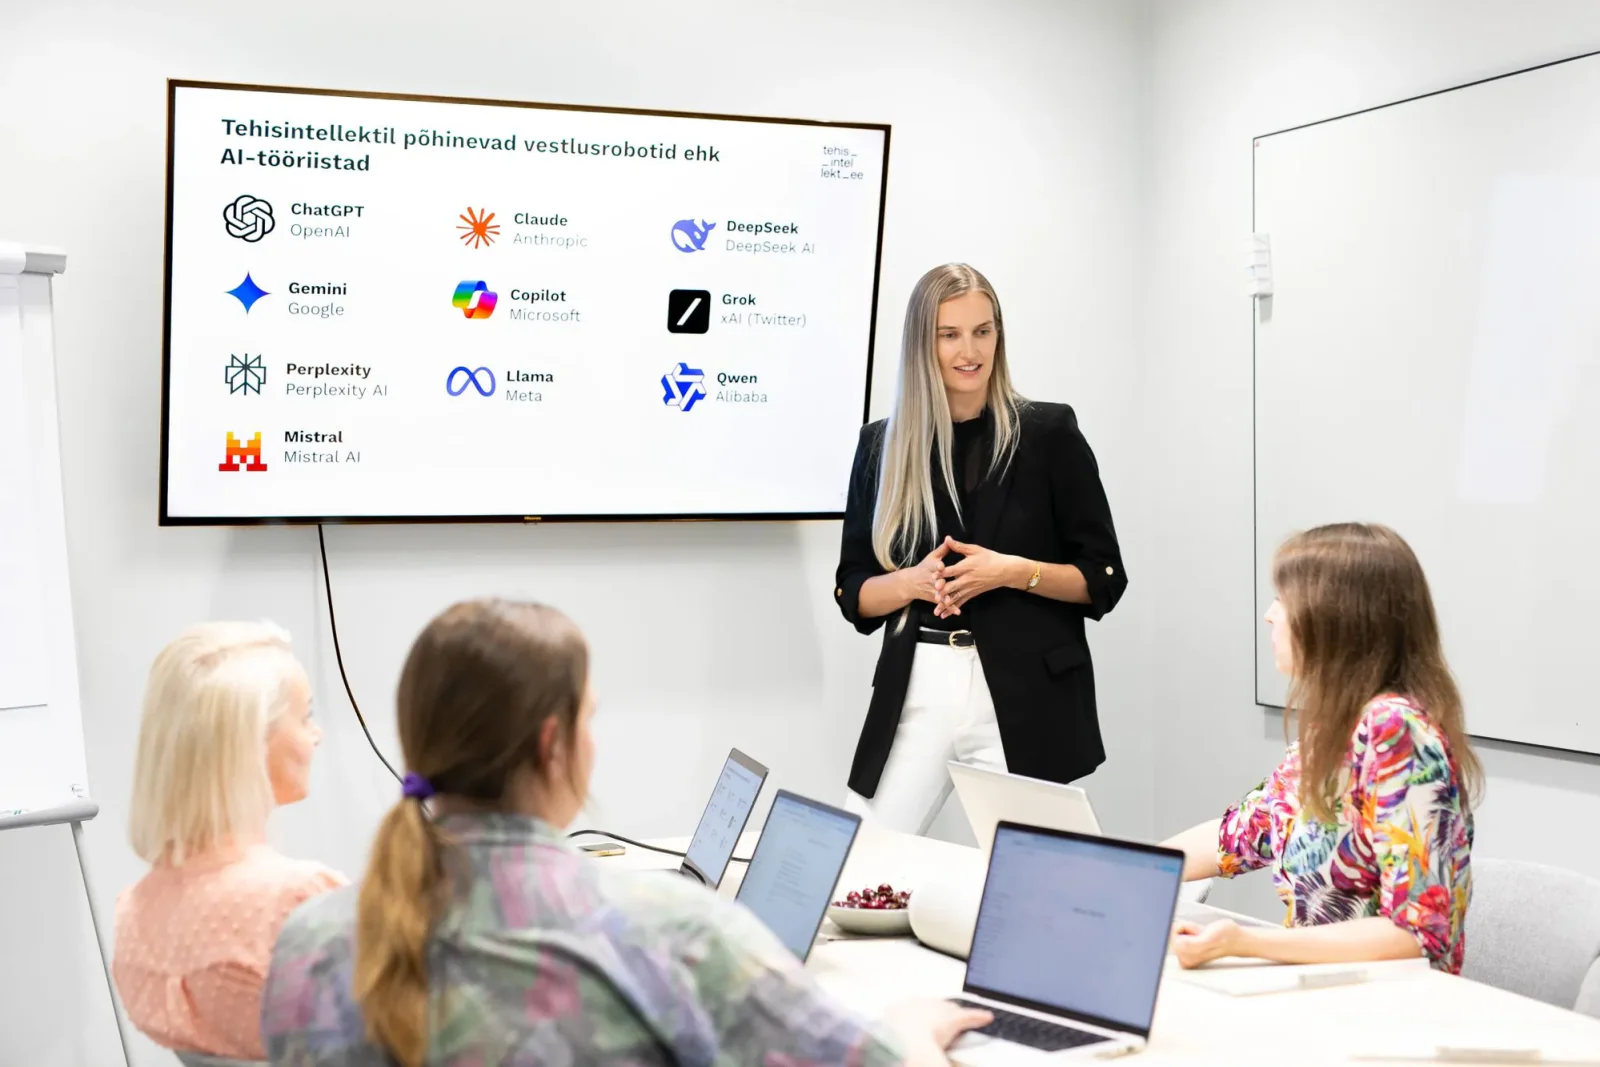
A modern environment built for learning awaits you. Every participant has their own comfortable workspace and a clear view of the screen, for the best possible learning experience.





KAIA SALUMETS
NG Investeeringud OÜ
Chief Accountant
Encouraging and practical
We gained the courage to experiment and to see how to make our work easier. A start has been made and I am very grateful for it. I especially liked the practical examples. At the same time, I understand that consolidating skills and deepening knowledge requires a lot more practice.
Do you have any questions?
Anna can help with registration, how the training is organised and applying for the Töötukassa training grant.
Training provider contact and details
- Training organiser
- Tehisintellekt OÜ
- Registry code
- 16967299
- Economic activity notice no.
- 259383
- Contact person
- Anna Borovikova
- Phone
- +372 5886 9046
- info@tehisintellekt.ee